Observability Isn't Uptime: It's Knowing What Breaks the Business
Observability is uptime, monitoring and telemetry plus your inventory and business flows, so you can see which flow breaks when a switch, server or circuit goes down. Without it, a digital twin can’t tell you what a change means, and automation and AI work blind.
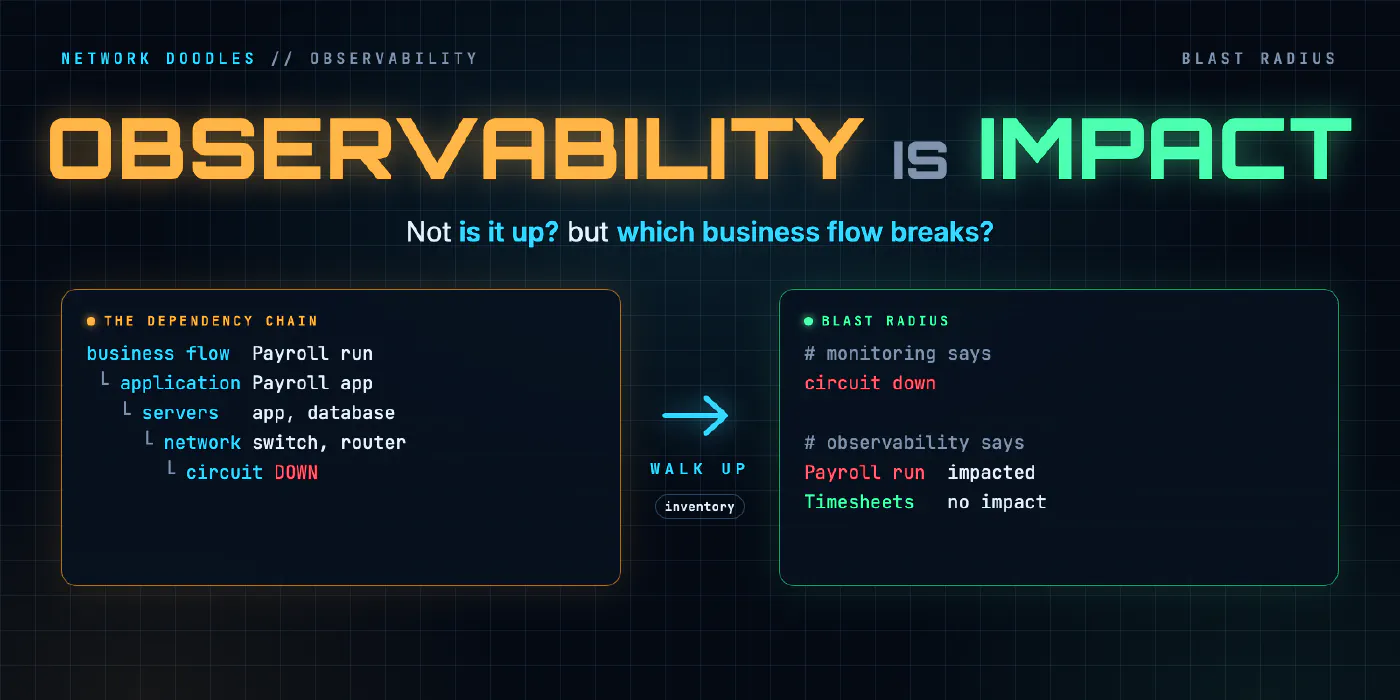
I hear “observability” used for a lot of things. A dashboard full of green interfaces. A syslog server. A streaming telemetry pipeline. An uptime report that says 99.99%. Each of those is a piece of it. None of them is observability.
What did a room full of network engineers say observability was?
At the October 14 meeting of PA NUG, the PA Network Users Group, I was on the discussion panel, and we turned some questions around on the audience. What’s your company’s observability strategy? What’s the observability strategy inside your networking group? Or, simplest of all: can you define what observability means?
The answers were shocking. They had no idea what their company’s observability strategy was. Most of them couldn’t define observability at all. When they tried, they mostly tied it to up/down status and tools like SolarWinds. And when we asked about the strategy for just the networking piece, it came down to monitoring, not observability: collecting telemetry, without defining what any of it means for the business.
That isn’t a knock on the people in that room. When a word gets used for every product on the market, nobody stops to say what the goal is.
Here’s my definition, and the rest of this post argues for it: observability is understanding how anything in your environment can impact your business flows. That means seeing end to end, across the network, the servers, the applications, and the circuits and providers underneath them, with an inventory that says how they all connect.
What isn’t observability?
Observability isn’t uptime. It isn’t monitoring. It isn’t telemetry. It’s all of those things, plus your inventory and your business flows. The first three are inputs. On their own, each one answers a narrower question than the one the business is asking.
| What you have | The question it answers | What it can’t tell you |
|---|---|---|
| Uptime | Was it up, and for what share of the month? | Whether anything that mattered was affected while it was down |
| Monitoring | Is this device, link or service up or down right now? | What depends on it |
| Telemetry | What’s the CPU, the error count, the latency, the interface rate? | Whether those numbers mean a business problem |
| Inventory | What do we have, where is it, and how is it connected? | Whether it’s healthy right now |
| Business flows | What does the business actually do, and what does each flow need? | Nothing, unless it’s mapped to everything above |
Read down the right-hand column. Every piece leaves a gap, and the gaps are where outages turn into long nights. A switch can be up while the application behind it is failing. A circuit can be green while it’s dropping enough packets to time out a file transfer. A server can be “healthy” while it’s the one database three business flows can’t live without.
What is observability, then?
Observability is being able to see end to end. Not just “is a switch up or down”, “is a circuit up or down” or “is a site up or down”, but “if that site or that server is down, which business flow is impacted?”
A business flow is something the business does that people would notice if it stopped: taking an order, running payroll, admitting a patient, shipping a package. Each flow runs on applications. Each application runs on servers. Those servers sit on network infrastructure, and that infrastructure depends on circuits and service providers. That’s a chain, and observability means you can see the whole chain at once.
So observability has four parts, and you need all of them:
- Signals: the up/down state, metrics, logs and telemetry from every layer.
- Inventory: what exists, where it is, and what it’s connected to. This is your source of truth.
- Dependencies: which application runs on which servers, which servers hang off which switches, which site rides which circuit from which provider.
- Business flows: the top of the chain, mapped down to the applications they use.
The signals tell you something changed. The other three tell you what it means.
What is blast radius?
Blast radius is everything that’s affected when one piece fails. Not the device that alarmed: everything upstream of it that stops working, all the way up to the business flows. The same failure can have a tiny blast radius or a huge one, and you can’t tell which from the alarm.
Here’s a hypothetical example. Say the payroll app runs on an app server and a database server in your data center. Each pay period it sends a payment file to the bank, out through the WAN router and a provider circuit. A second flow, timesheets, uses a different app server but the same database. Step through it and watch what each failure takes out.
A hypothetical environment. The point is the chain, not the devices.
The circuit alarm and the database reboot are both “one thing down.” Their blast radius is completely different. If all you can see is device state, you can’t tell those two apart, and that’s the difference between a quiet note to the payroll team and a call to every manager in the company.
Why can’t the network, servers and apps stay in silos?
Observability has to measure the entire environment: the network, the servers and the applications. And not in silos. They need to talk to each other.
In a lot of shops each team has its own tool. The network team watches interfaces and routing. The server team watches CPU, memory and disk. The application team watches response times and errors. Someone else holds the circuit IDs and the provider contacts in a spreadsheet. Every one of those tools can be excellent, and you can still be blind, because none of them knows what’s connected to what.
Applications are connected to the servers they run on, the network infrastructure they depend on, and the circuits and service providers they depend on. If those relationships only live in people’s heads, every incident starts with a conference bridge where each team proves its own piece is green. Meanwhile the business flow is still down.
| Siloed tools | Connected observability |
|---|---|
| “Switch 4 is down” | “Switch 4 is down, and it carries the payroll database” |
| Each team checks its own dashboard | One view walks the chain from the failure up to the flows |
| Impact found by asking around on a bridge call | Impact known from the dependency map before the bridge starts |
| Circuits tracked in a spreadsheet | Circuits and providers in the inventory, tied to the sites and apps that use them |
| Alerts ranked by device | Alerts ranked by which business flow they touch |
The inventory is the glue. A source of truth like NetBox already knows your sites, devices, cables, circuits and providers. I’ve written before about using NetBox as your Ansible inventory. The same data is what lets an alert on a circuit become “these sites, these apps, these flows.” What’s usually missing is the top of the chain: applications and business flows mapped onto that infrastructure.
Why is a digital twin almost useless without observability?
You can build a digital twin or you can buy one. A digital twin is a model of your environment that you can change and test without touching production. The idea is good. The problem is what it can tell you.
If the twin isn’t attached to full observability, where you understand the actual impact to the business, it’s almost useless. It will tell you “I put this in, this goes down.” But what does that actually mean? If you can’t answer that question, it’s not a valid test.
A twin built on network data alone reports network state: routes withdrawn, interfaces down, a port blocked. The change board wants to know whether payroll still runs on Friday. A twin that can’t say hands that question back to a person, who answers it from memory, which is the same guess you’d make without a twin. Attach it to observability and the same simulation gives a different answer:
| Twin without observability | Twin with observability |
|---|---|
| “These interfaces go down” | “These interfaces go down, so the payroll and timesheet flows lose their database” |
| “Route to this prefix withdrawn” | “That prefix is the bank’s file transfer endpoint, used only by payroll” |
| Pass or fail on network state | Pass or fail on business impact |
| Someone still has to interpret it | The result is the impact statement |
Then a real digital-twin analysis of blast radius gives real data. You can understand the actual business impact of a potential change before you make it, and you can schedule it, staff it and communicate it based on that.
Why is observability the foundation for automation and AI?
You can’t automate what you can’t see. You can’t predict what you can’t see. And AI can’t act if it doesn’t have context for what your actual environment is.
Automation needs to know what it’s touching. A playbook that reboots a switch is easy to write. Knowing whether it’s safe to run at 2 p.m. on a Tuesday is the hard part, and that’s an observability question. Without it, automation runs exactly as fast as your riskiest guess.
Prediction needs history and context together. You can trend a circuit’s errors or a server’s disk all day, but a forecast only matters when you know what depends on the thing you’re forecasting. “This disk fills in 9 days” is a ticket. “The payroll database fills in 9 days, before the next pay run” is a priority.
Agentic operations, where an AI agent investigates and proposes changes, depend on it even more. An agent reasons over whatever context you give it. Give it interface counters and it will reason about interface counters. Give it the inventory, the dependencies, the telemetry and the business flows, and it can reason about impact. When we took the InfraGenie hackathon agent to production as ODIN, the piece we added in front of every change was exactly this: observability, telemetry, correlation and context, so the agent finds the root cause first. I wrote that up in From InfraGenie to ODIN.
Here’s how I think about the order:
- See it: signals, inventory, dependencies and business flows, connected.
- Understand it: blast radius for any piece that fails or changes.
- Test it: a digital twin that reports business impact, not just network state.
- Act on it: automation and agents that work from that context, with humans approving what matters.
Skip step 1 and every step after it is built on a guess.
Here’s what I see go wrong
These are the patterns I run into over and over.
- Calling a dashboard observability. A wall of green interfaces looks like control. It tells you the devices are up, not that the business is working.
- Measuring uptime instead of impact. A device can hit 99.99% and still have been down during the one hour that mattered. Uptime without context can’t tell you which hour that was.
- Keeping the inventory separate from the signals. The source of truth lives in one tool, the alerts in another, and nothing joins them. Every alert then needs a human to look up what it means.
- Leaving circuits and providers out. Circuit IDs, providers and contacts in a spreadsheet nobody updates. The circuit is often the piece with the biggest blast radius and the least visibility.
- Never mapping the business flows. The infrastructure is documented down to the cable, and nobody has written down which applications payroll actually uses. The top of the chain is missing, so impact can’t be calculated.
- Buying a twin first. A twin shows network state changes nicely. Without the dependency map it has nothing to say about the business, and it gets used for a few demos.
- Pointing automation or AI at a blind environment. Automating changes, or handing an agent tools, before it can see dependencies means it acts fast on incomplete information.
- Trying to map everything at once. That project never ends. One flow, done end to end, teaches you more.
Where do I start?
Start small, and start from the top of the chain, not the bottom.
- Pick one critical business flow. Ask the business which one would hurt most if it stopped. Write it down in plain words.
- Map it end to end. List every application it uses, every server those apps run on, the network infrastructure those servers depend on, and every circuit and provider in the path. Expect surprises: a shared database, a single circuit, a server nobody owns.
- Tie it to your inventory and source of truth. Put those dependencies where your inventory lives, so the map is data and not a diagram that goes stale. Sites, devices, circuits and providers are probably there already. Add the applications and the flow.
- Add signals to every piece in the chain. Up/down, metrics and logs for each layer, from the circuit to the application, so a failure anywhere shows up against the flow it affects.
- Ask the blast-radius question. For each piece in the chain: if this goes down, what happens to the flow? If you can answer it from data, you have observability for that flow. Then pick the next one.
Once one flow works like that, a digital twin has something real to test against, and automation has something real to act on.
Change testing, automation and AI all sit on top of observability. Build that first.
Related doodles
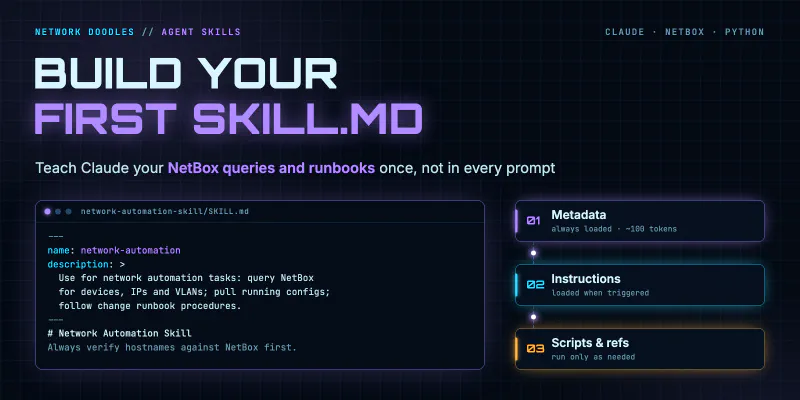
Anthropic Agent Skills for Network Automation: Build Your First SKILL.md
Learn how to build Anthropic Agent Skills for network automation, including a complete SKILL.md example with NetBox queries, device config retrieval, …
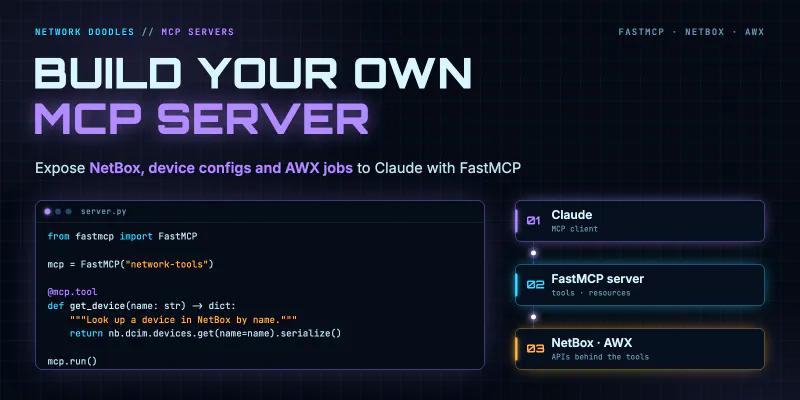
Build Your Own MCP Server for Network Automation Using FastMCP
A hands-on guide to building an MCP server that exposes NetBox queries, device configs, and AWX job templates directly to Claude using FastMCP and …
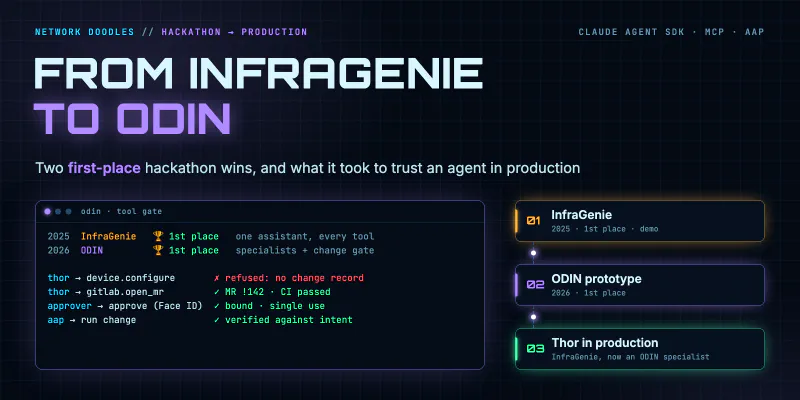
From InfraGenie to ODIN: Taking a Hackathon AI Agent to Production
InfraGenie won a hackathon by flipping one idea: agents propose, automation fixes. ODIN takes that framework to production and adds the part before …