Your Network Automation ROI Number Is Probably Marketing (AutoCon 6, Part 5)
Jonathon Davis’s AutoCon 6 method for measuring what an automation returned: a human baseline, oversight subtracted, real costs, priced failures, and productivity kept apart from hard savings.
part 5 of 11 · series AutoCon 6
- 1State of automation: start with your alerts
- 2Digital twins at scale
- 3Observability and blast radius
- 4AI evaluation
- 5Automation ROI
- 6Leading radical change
- 7Build vs. buy
- 8Wouldn't it be cool if...
- 9Lightning: the PB&J method
- 10Lightning: 3,000 routers
- 11Lightning: how much code is enough
Jonathon Davis opened his AutoCon 6 talk with a script he wrote years ago to dial 50 modems and open a ticket for any that didn’t answer. Nobody sat down with a list anymore, and the check went from monthly to weekly. Everyone agreed it was a success. When leadership asked what it was worth, he had no answer. He could feel the savings, but he couldn’t put a number on them.
That’s the normal case. His argument: part of the network automation adoption ceiling is an accounting ceiling, and accounting is something we can fix.
Why don’t finance teams trust automation time-saved numbers?
Most automation value is never measured. What does get measured usually comes from the platform that did the work, and its time-saved dashboard inflates in four ways:
- Minutes are an estimate someone typed in, with no human oversight subtracted.
- Runs count only that platform, and only successes.
- Cost is zero. A failed run that burned compute and tokens is invisible, or counted as savings.
- Window is whatever looks biggest. A good week times 52.
None of that is fraud, but it’s a platform grading its own homework. Finance discounts it on sight, and they’re right to.
How do you measure what a network automation returned?
- Baseline from a human. Stopwatch the manual task. Only runs that replace a real manual run earn labor value. Extra runs because automation made it cheap get counted but earn nothing.
- Subtract oversight. Babysitting time comes off the top.
- Charge real costs: build, recurring and per-run, including tokens. Engineering time is the biggest cost and the one most often left out.
- Price failures. Every run pays its cost. Only successful runs earn value.
- Separate productivity from hard savings. Hours returned are productivity. Hard savings means a budget line went down. Cost avoidance is planned spend that didn’t happen. Calling productivity hard savings is the most common mistake.
- Payback from trailing actuals. Choose the window first (90 days is a good start) and don’t move it.
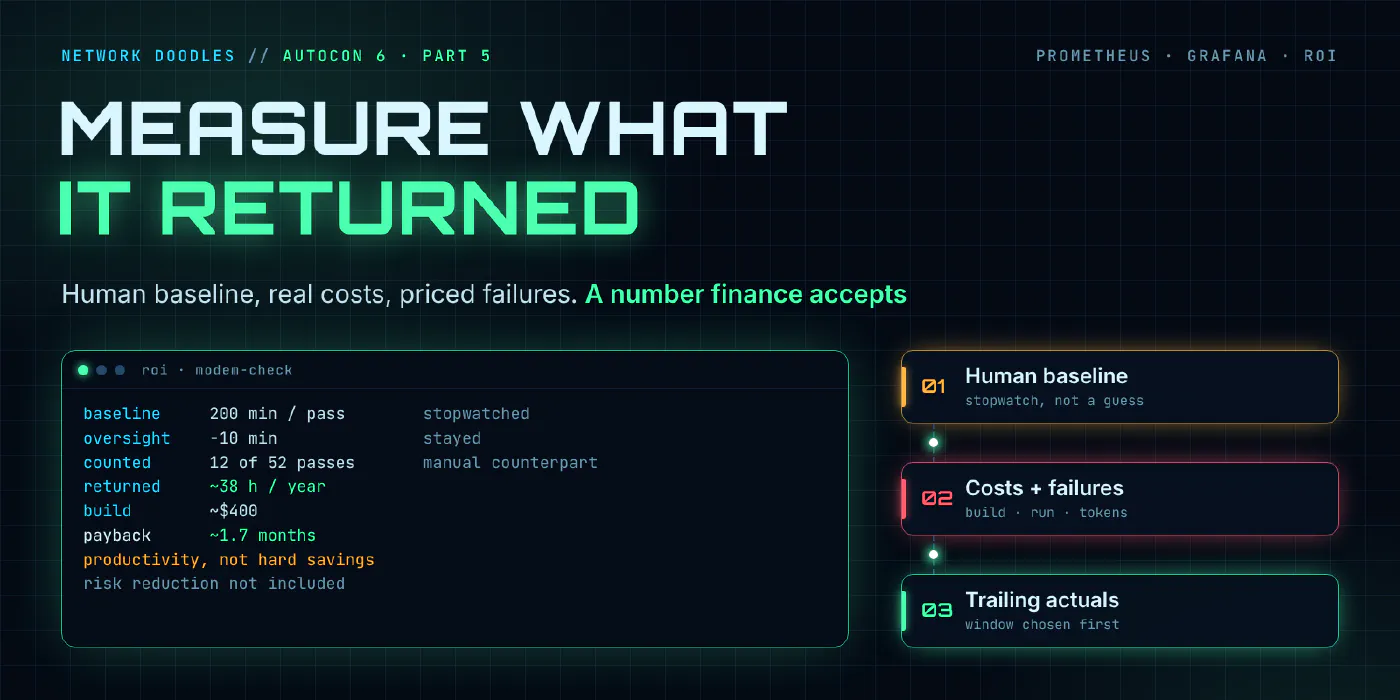
His modem example: 190 net minutes per pass, 12 of 52 annual passes with a manual counterpart, about 38 hours a year returned. At a $75 loaded rate that’s about $2,850 of productivity, not hard savings, because no budget line moved. Build cost about $400, payback about 1.7 months.
His slide for leadership was three lines: about 38 NOC hours a year, paid back in about 1.7 months, risk reduction not included. A small number he can defend beats a big one he can’t.
He open-sourced the method as the Automation ROI Starter Kit: MIT licensed, built on Prometheus, Grafana and one standard-library Python file, with no vendor in the data path. The guardrails are built in. There’s no default for manual minutes, oversight is a required field, runs without a baseline get a count but no dollars, and productivity and hard savings are never summed. His instructions: fork it, put your measured numbers in, report every run.
My take: say what it isn’t, and the rest gets believed
This was the most useful talk of the week for anyone who has to justify automation spend. In pre-sales I get asked for payback on almost every engagement, and too often the only number available is a vendor’s time-saved estimate. The productivity versus hard savings split is the part I’m taking home. Saying “this returns 38 hours, it doesn’t cut a budget line” up front makes every other number in the deck believable.
The other part I’d underline: report failures next to successes. Reporting only successes is marketing. It also explains the survey finding from part 1 of this series, Where Do You Start Automating Network Troubleshooting?: about half of organizations don’t measure automation at all. Nobody wants to publish a number they know won’t survive scrutiny.
Where I’d add something is risk reduction. The formula rightly leaves it out of payback, but for read-only automation like backups, validation and finding dead backup paths before you need them, risk reduction is most of the value. Jonathon suggested pricing it as the cost of a past outage times the reduction in probability, and discounting it hard. I’d track it in its own field, never summed into payback, with the same discipline as everything else. The outage-cost side of that is a blast radius question, which is one more reason observability comes before automation.
What four questions should you ask of any automation ROI number?
- Whose minutes? Measured or guessed? Oversight subtracted?
- Which runs? One platform or all? Successes only?
- What did it cost? Build, recurring, per-run, failures?
- What window? Trailing actuals, or the best week annualized?
He ran the questions against a real platform’s time-saved dashboard, and it failed all four: a typed-in estimate per workflow with no oversight field, its own successes but not its failures, no rate or costs with failed runs missing entirely, and a one-week total that’s easy to annualize. Then he ran them against the kit: your measured minutes with oversight subtracted, every run including failures, build, recurring, per-run and token costs with failures priced, and only the runs Prometheus actually observed.
Run them over your own numbers before someone in finance does.
This is part 5 of my AutoCon 6 series.
Related doodles
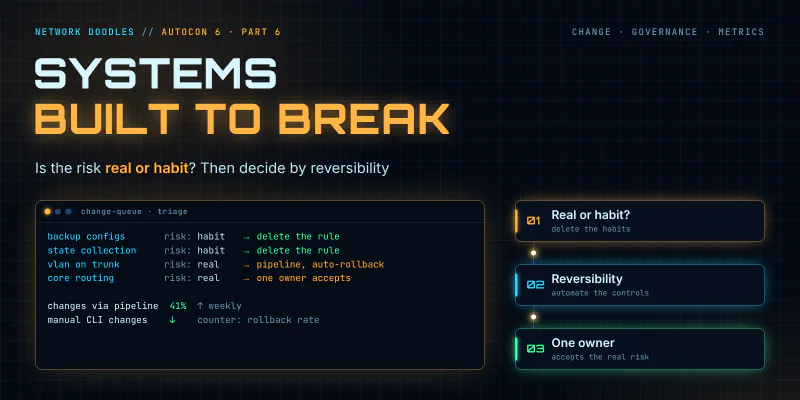
Everything Is Working Exactly as Designed. That's the Problem. (AutoCon 6, Part 6)
Anna Claiborne's AutoCon 6 talk on leading radical change, read as a network automation playbook: governance built to say not yet, sacred cows, the …
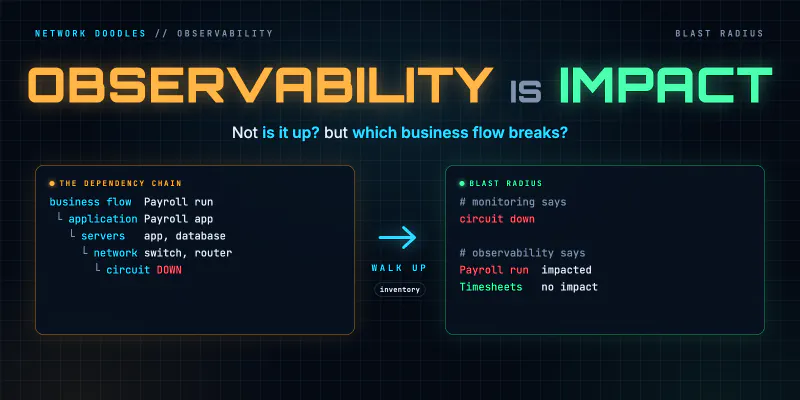
Observability Isn't Uptime: It's Knowing What Breaks the Business
Observability is uptime, monitoring and telemetry plus your inventory and business flows, so you can see which flow breaks when a switch, server or …
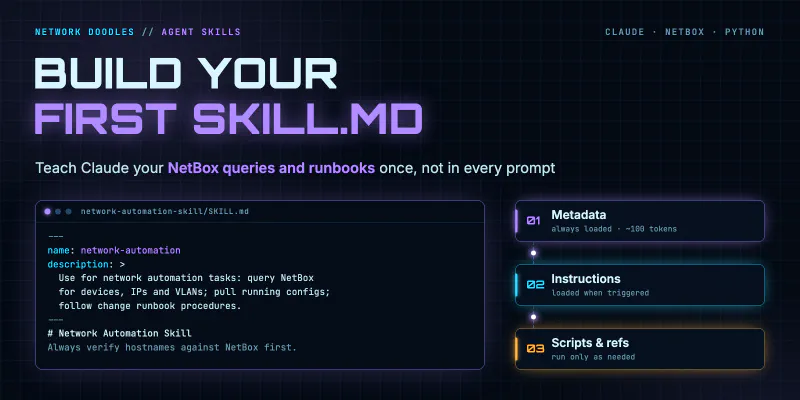
Anthropic Agent Skills for Network Automation: Build Your First SKILL.md
Learn how to build Anthropic Agent Skills for network automation, including a complete SKILL.md example with NetBox queries, device config retrieval, …