Where Do You Start Automating Network Troubleshooting? Your Alerts
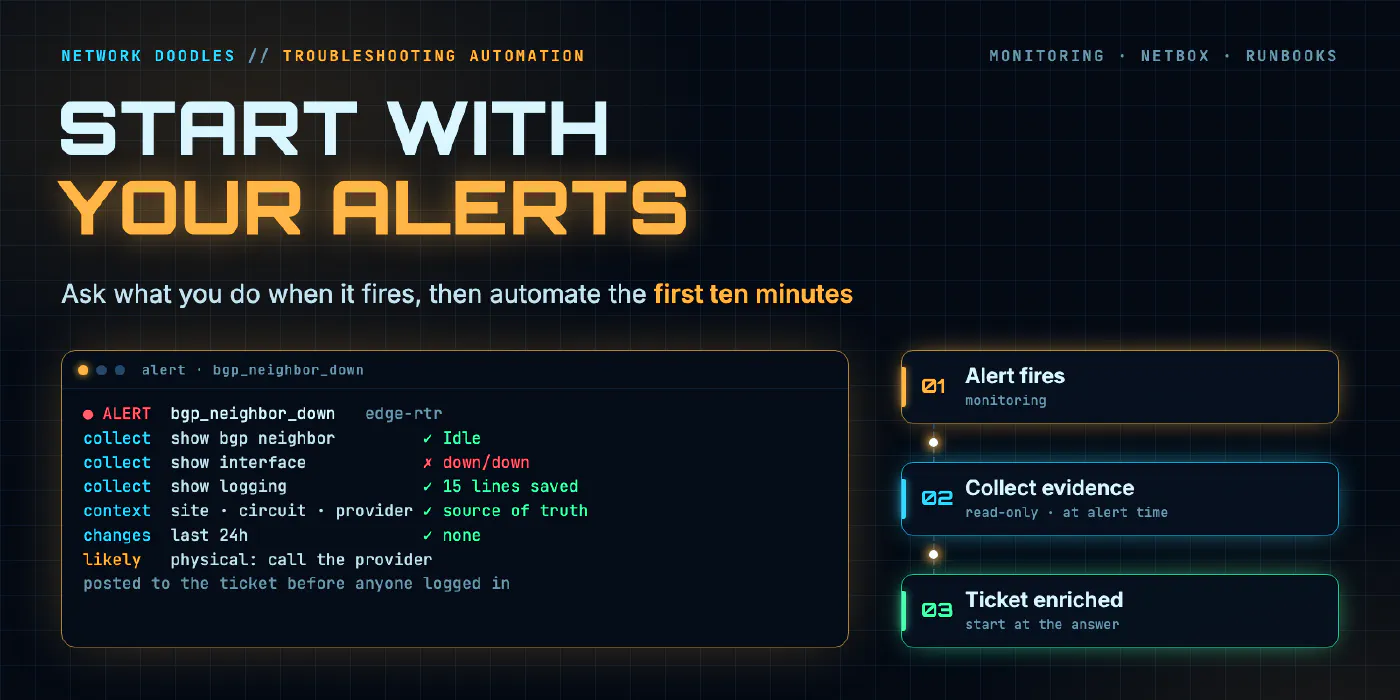
Teams skip troubleshooting automation because they can’t plan for unknown failures. You don’t have to. Every alert in your monitoring is a failure someone already decided matters. Ask what you do when it fires, write that down, and automate the first ten minutes.
part 1 of 11 · series AutoCon 6
- 1State of automation: start with your alerts
- 2Digital twins at scale
- 3Observability and blast radius
- 4AI evaluation
- 5Automation ROI
- 6Leading radical change
- 7Build vs. buy
- 8Wouldn't it be cool if...
- 9Lightning: the PB&J method
- 10Lightning: 3,000 routers
- 11Lightning: how much code is enough
Why don’t more teams automate troubleshooting?
I was in the room at AutoCon 6 in Tucson in November 2026 when Chris Grundemann of the Network Automation Forum presented the 2026 State of Network Automation Survey results. Troubleshooting is the biggest gap in that survey, and it has been the biggest gap in all four years it has run. Among the 344 respondents doing some automation, 66.3% say troubleshooting should be automated and 13.4% have it fully automated.
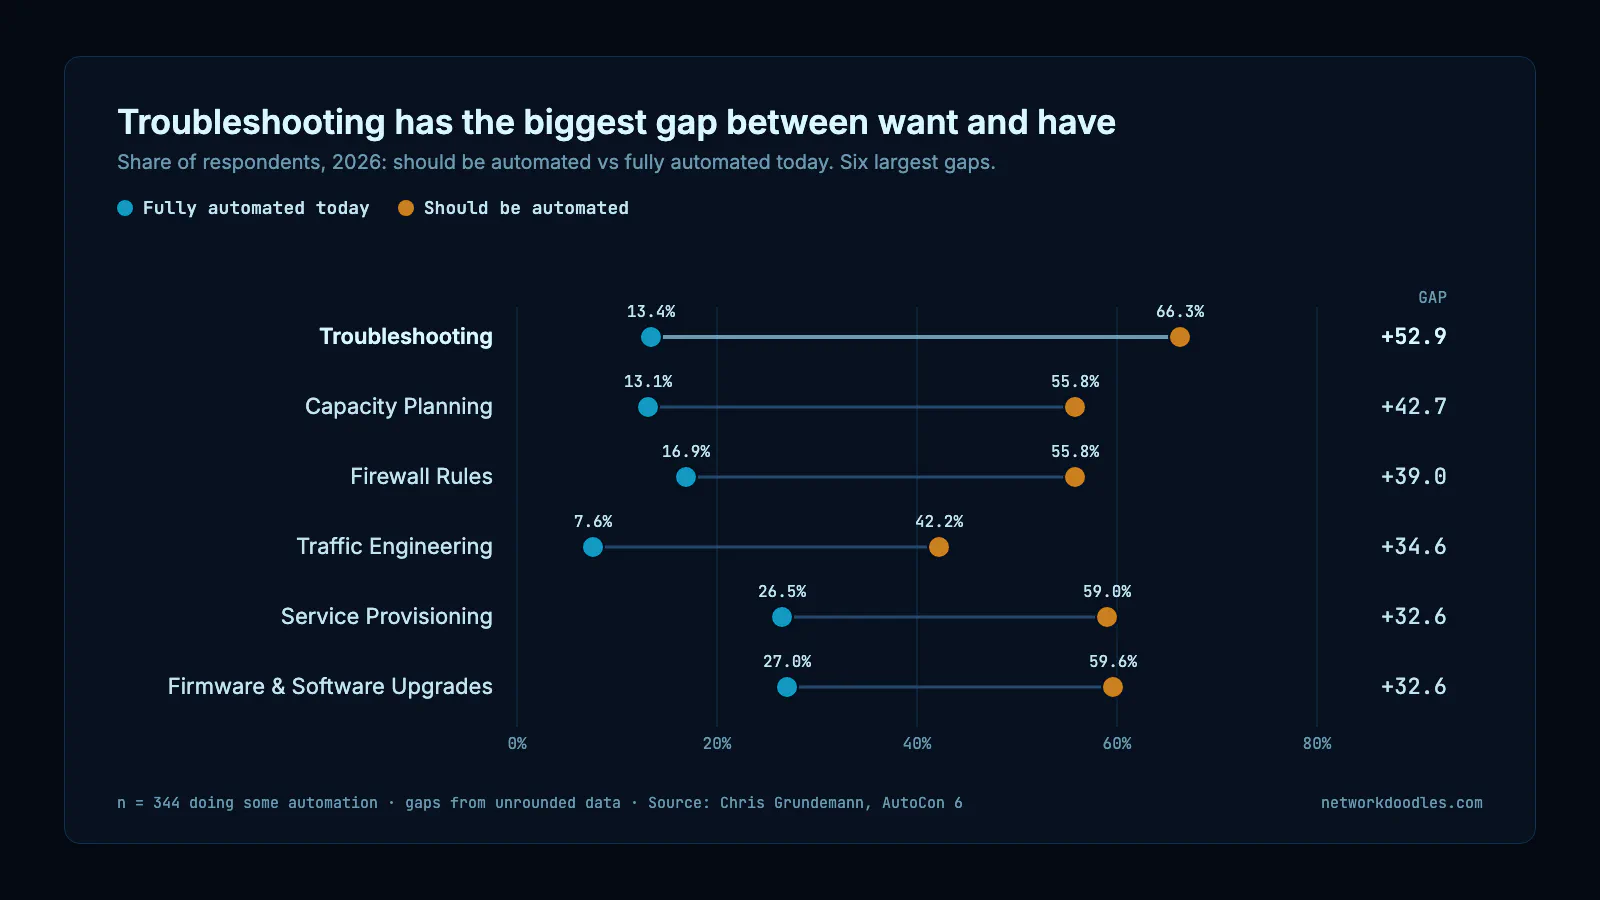
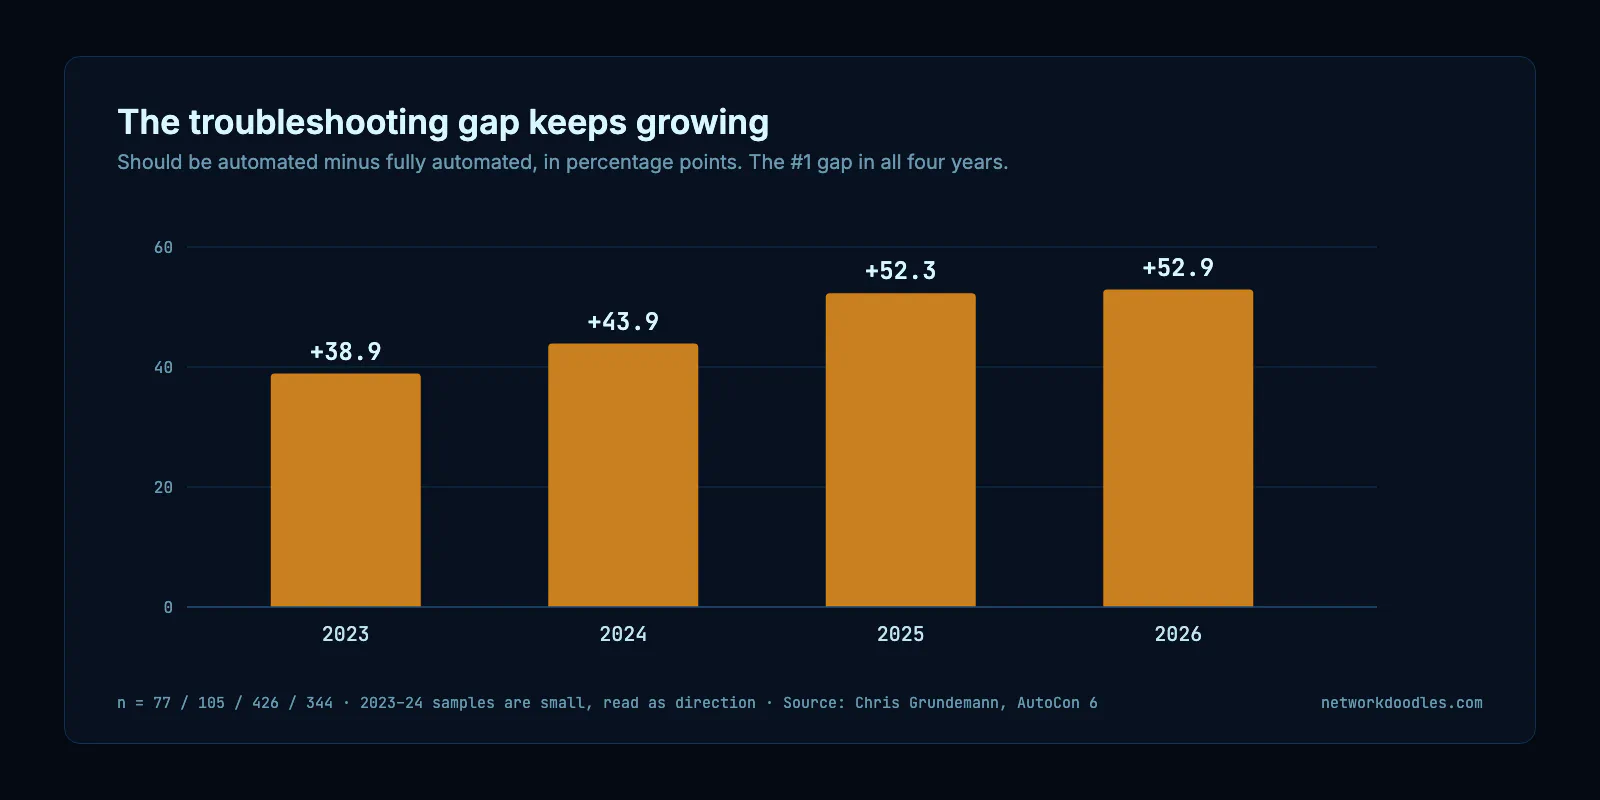
That gap has grown every year, from 38.9 points in 2023 to 52.9 points in 2026.
| Task (2026) | Should be automated | Fully automated | Gap (points) |
|---|---|---|---|
| Troubleshooting | 66.3% | 13.4% | +52.9 |
| Capacity planning | 55.8% | 13.1% | +42.7 |
| Firewall rules | 55.8% | 16.9% | +39.0 |
| Traffic engineering | 42.2% | 7.6% | +34.6 |
| Service provisioning | 59.0% | 26.5% | +32.6 |
| Firmware and software upgrades | 59.6% | 27.0% | +32.6 |
Survey data from Chris’s slides: 344 respondents doing some automation in 2026, gaps computed from unrounded data. The 2023 and 2024 samples (77 and 105) are small, so read the early years as direction.
Chris’s explanation of that gap is what stuck with me. He didn’t think people were ignoring troubleshooting. “I think the troubleshooting is hard,” he said. Fully automating it means understanding a lot of unknown unknowns: “you’re not going to know what breaks ahead of time.” And then: “a lot of people are automating troubleshooting, but it’s not getting fully automated. Maybe they won’t ever.” You can’t write a playbook for a problem you haven’t seen yet, so people don’t start.
I don’t think full automation is the goal anyway. The win is the part in between.
The unknowns are a problem if you think of troubleshooting as “every possible failure in the network.” Nobody can automate that. But it’s the wrong starting point, because most teams already have a list of the failures they care about. It’s sitting in the monitoring system.
If you monitor it, does it matter?
Yes. Every alert in your NMS exists because someone decided that condition was worth waking a person up for. A BGP neighbor dropping. An interface taking CRC errors. A WAN circuit crossing 90% utilization. A power supply failing. Someone thought about each of these, set a threshold and wired it to a pager or a ticket queue.
That’s a requirements document for troubleshooting automation. It’s scoped, it’s prioritized, and it already has a trigger attached.
So the question stops being “how do I automate troubleshooting?” and becomes much smaller:
When this alert fires, what’s the first thing you do?
Ask that of your senior engineer for one alert. They’ll answer in about thirty seconds. “I log into the box, check the neighbor state, look at the interface the session rides on, check the logs for flaps, and see if the peer is reachable.” That’s a runbook. Write it down, then automate it.
Which alerts should you automate first?
Don’t start with your scariest alert. Start with the one that costs the most human time.
Export 90 days of alert history and rank each alert type by:
| Factor | Why it matters |
|---|---|
| How often it fires | The interface-errors alert that fires 40 times a week beats the core-switch-down alert that fired once last year |
| Time to the first useful fact | If every instance means SSH to three devices and eight commands before anyone knows anything, that’s your target |
| How often the answer is the same | If 80% of the time it’s the same root cause, the automation pays off fast |
Frequency times triage time gives you a rough ranking. Take the top three and ignore the rest for now.
What does the automation actually do?
The goal isn’t to automate the fix. It’s to automate the first ten minutes of investigation, the part where an engineer gathers context before they can think.
To find out what those ten minutes look like:
- Sit with the engineer who handles that alert best and watch them work it. Write down every command.
- Read the notes on the last 20 tickets for that alert. The same commands and checks show up again and again.
- Look at shell history or session logs if you keep them.
You’ll end up with something like this for a BGP neighbor down alert:
alert: bgp_neighbor_down
collect:
  - show bgp neighbor {peer_ip}
  - show interface {local_interface}
  - show logging | include {peer_ip}|{local_interface}
  - ping {peer_ip} source {local_ip} repeat 5
context:
  - source_of_truth: circuit, provider, site, criticality
  - recent_changes: last 24h on this device and its peer
checks:
  - interface_down: "physical problem, check circuit with {provider}"
  - interface_up_ping_fails: "L2/L3 path issue between peers"
  - ping_ok_session_down: "BGP config, auth, or peer-side policy"
  - flapping: "count transitions in last hour, check for errors on interface"
output: post findings to ticket, tag on-call
That’s not clever, and it doesn’t have to be. It turns a page that says “BGP DOWN” with a peer address into a ticket that says “Gi0/0/1 is down, the circuit is Provider X at the Denver site, no config changes in 24 hours, here are the last 15 log lines.” The engineer starts at the answer.
Why does running at alert time matter so much?
Plenty of network problems are transient. A link flaps, a CPU spikes, a buffer fills, and by the time a human acknowledges the page and logs in, the counters have rolled and the state is gone. Automation that runs the moment the alert fires captures the network as it was during the problem, not five or fifteen minutes later. For intermittent issues that alone can be the difference between a root cause and “couldn’t reproduce, closing.”
Is it safe to let automation touch production?
Collecting data and posting it to a ticket is about as safe as automation gets. show commands can’t take
anything down. That matters for buy-in: the ops team that would never let a script bounce an interface will
happily let one run read-only commands and save them time.
The survey backs this up. Of respondents who are 10-20% automated, 55.3% describe their automation as read-only: backups, documentation, monitoring. From the stage, Chris called read-only a clear place to start: “You build your skills, you build team skills, you build trust with management.” His slides add that troubleshooting can start read-only too. And the gap is about full automation: 47.4% already have troubleshooting at least partially automated, so many teams have pieces of this already.
Once that’s trusted, there’s a natural progression:
- Enrich. Add context from the source of truth and attach command output.
- Diagnose. Run the decision tree and suggest a likely cause.
- Recommend. Propose the fix and let a person approve it.
- Remediate. Auto-fix the low-risk, well-understood cases, such as an err-disabled port with a known cause.
Most teams will get plenty of value staying at step one or two for a long time. I went further into the “agents propose, a person approves” end of this in From InfraGenie to ODIN, and the hands-on version, a webhook receiver that gathers evidence and proposes a change, is lesson 8 of the observability course.
What if nobody knows what to do when an alert fires?
When you ask “what do you do when this fires?”, sometimes the honest answer is “nothing, we ignore it” or “I don’t know.” That’s not an automation problem. That alert is noise, and noise trains people to ignore the pager. Either define what the response should be or delete the alert. This exercise cleans up your monitoring as a side effect, and it’s worth doing for that reason alone.
It works in the other direction too. If an engineer’s first step for an alert is always checking something your NMS doesn’t watch, like optic light levels or a specific log message, that check should probably be its own alert. Every postmortem that ends with “we didn’t know until a user called” is a new entry for the monitoring list, which makes it a new entry for the automation list.
Where does the source of truth fit?
Raw command output only goes so far. What makes an enriched alert useful is context: which site, which circuit ID, which provider and their support number, how critical the device is, what’s downstream. If you have NetBox or Nautobot populated, the automation can pull that in, the same way it already does for NetBox as your Ansible inventory. It’s the difference between “interface down” and “the only uplink for the Denver clinic is down, call Provider X with this circuit ID.”
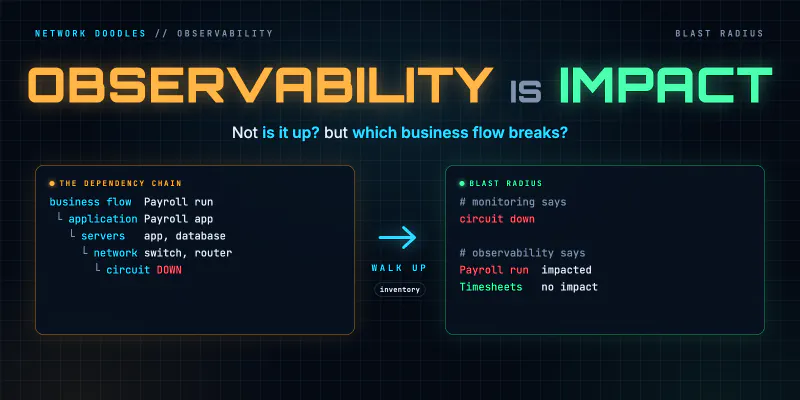
The same inventory lets you check upstream before blaming the device. One failure often throws many alerts: an upstream link fails and twenty downstream devices go unreachable. A good first step is to check whether a parent device or link is already in alarm and, if so, link the tickets instead of sending twenty separate investigations to twenty people. You don’t need a full correlation engine for that. A topology lookup and a check of open alerts gets you most of the way, and it’s a first step toward the blast-radius view of observability.
Where does AI fit?
LLMs are good at reading a wall of show output and writing a three-sentence summary. They’re less reliable at
deciding on their own which commands to run against production gear. The pattern that works: let deterministic
automation collect the data your runbook defines, then hand that output to a model to summarize and suggest a
likely cause.
If you’re building agents with MCP tools, the runbook becomes the agent’s instructions and the read-only collectors become its tools. See build your own MCP server for that side. The runbook still has to come from someone who knows the network, which brings you back to the alert list.
How do you show it’s working?
In the same survey, 46.2% of respondents doing automation have no formal way to measure what it delivers. Teams with at least one dedicated automation engineer are more automated (45.0% vs 33.0%), more likely to validate in production (42.9% vs 16.0%), and less likely to skip measurement (32.7% vs 59.2%). Chris was careful to call those associations, not causes. His point in the room was simpler: without measurement, “it’s gonna be hard to build trust, to build budget, to gain staff” for more automation. Measuring is cheap to start.
Mean time to repair is noisy and depends on things automation doesn’t control, like waiting on a carrier. Measure the time from alert to first useful fact instead. If an engineer used to spend twelve minutes gathering data and now opens a ticket that already has it, that’s a number you can show every month. Also ask the on-call engineers whether the enrichment helped. If they ignore it, find out why.
Isn’t this just replacing engineers?
No. Every team has one or two people who know how to work a particular alert, and when they’re on vacation it takes three times as long. Writing their first ten minutes into code makes what’s in their head available at 2 AM to whoever’s on call. The junior engineer on night shift starts where the senior engineer would.
How do you start next week?
You don’t need a platform decision or a budget:
- Export 90 days of alerts and rank them by frequency times triage time.
- Pick the top one.
- Ask the person who handles it best what they do first. Write it down.
- Automate only the data collection, and post the results to the ticket.
- Ask the on-call engineers if it helped. Adjust, then pick the next alert.
The unknowns are real, but you don’t have to start with them. Your monitoring already told you what’s important. Start there.
Related doodles
Observability Isn't Uptime: It's Knowing What Breaks the Business
Observability is uptime, monitoring and telemetry plus your inventory and business flows, so you can see which flow breaks when a switch, server or …
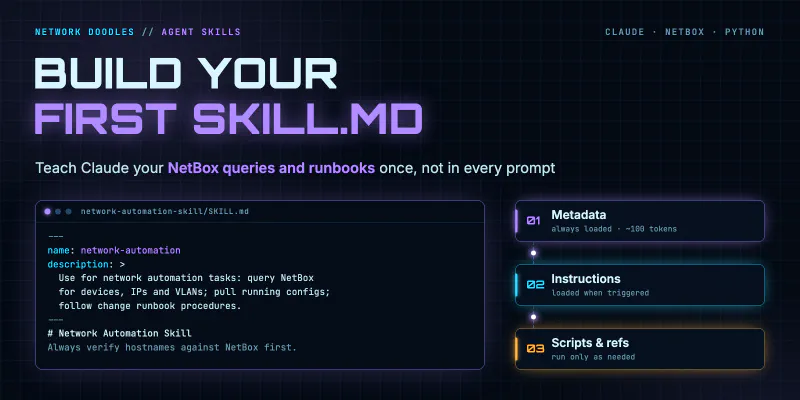
Anthropic Agent Skills for Network Automation: Build Your First SKILL.md
Learn how to build Anthropic Agent Skills for network automation, including a complete SKILL.md example with NetBox queries, device config retrieval, …
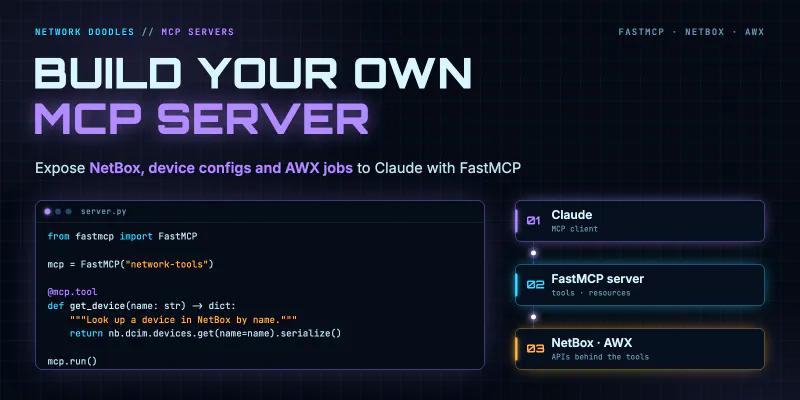
Build Your Own MCP Server for Network Automation Using FastMCP
A hands-on guide to building an MCP server that exposes NetBox queries, device configs, and AWX job templates directly to Claude using FastMCP and …