What a Packet Capture Shows You (Wireshark 101, Lesson 1)
A packet capture is a recording of the frames that crossed one point in the network. Wireshark’s three panes, timestamps, pcap vs pcapng, and why where you capture decides what you see.
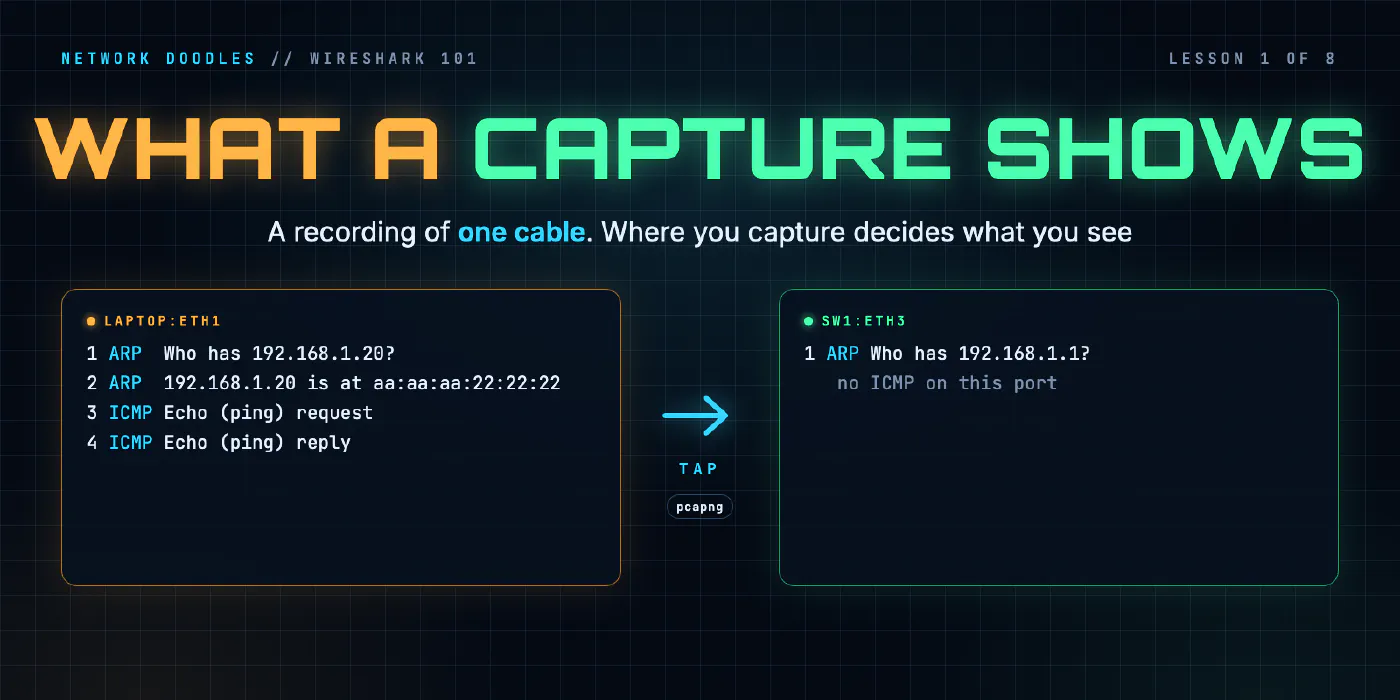
lesson 1 of 8 · course Wireshark 101
- 1What a capture shows
- 2Capture vs display filters
- 3ARP: finding the neighbor
- 4DHCP: getting an address
- 5DNS: names to addresses
- 6TCP: handshake, data, teardown
- 7TLS without decrypting it
- 8Troubleshooting a broken path
A packet capture is a recording of every frame that crossed one point in the network while the recording ran: each one bit for bit, with the time it was seen. Wireshark opens that recording and decodes it, layer by layer. The most important thing to know about a capture is that it only shows its own point. Pick the wrong cable and you see nothing, and nothing looks exactly like it never happened.
Networking 101 explained what MAC addresses, IP addresses, switches and routers are. This course shows you what they actually put on the wire. This first lesson is about the tool itself: what’s in a capture, how Wireshark lays it out, what the timestamps mean, the two file formats, and the question every capture starts with: where am I listening?
What is a packet capture?
Everything you’ve used to look at a network so far is a summary. ip neigh shows what a host concluded
about its neighbors. show mac address-table shows what a switch learned. A routing table shows what a
router decided. They’re all useful, and they’re all someone’s interpretation.
A capture isn’t. It’s the frames themselves, in the order they were seen, with nothing left out and nothing summarized. When a show command and a capture disagree, the capture is the one that’s telling you what happened. That’s why engineers reach for it when everything else says the network is fine and the application says it isn’t.
Two words before we go on. A frame is a message in its layer 2 envelope: an Ethernet header with a to and a from MAC address, and something inside. A packet is, strictly, the layer 3 thing inside it, with IP addresses. Wireshark and everyone else say “packet” for both, and so will I, except where the difference matters.
Each frame in a capture is stored with a few extra facts the capture added:
- when it was seen, to the nanosecond in the lab’s files;
- where it was seen: the name of the interface it was captured on;
- how long it was on the wire, and how many of those bytes were saved (more on that in lesson 2).
Then the bytes, exactly as they were.
How do Wireshark’s three panes map to the layers?
Open a capture and Wireshark shows three panes, top to bottom.
| Pane | What it shows |
|---|---|
| Packet list | one line per frame: number, time, source, destination, protocol, length, a one-line summary |
| Packet details | the frame you clicked, one layer per line, each one opens to show its fields |
| Packet bytes | the same frame as raw hex. Click a field in the details and its bytes light up |
The packet list is for finding things. Here’s the start of the lab’s first capture, taken on the laptop’s cable while it pings the printer, as tshark (Wireshark’s command-line twin, version 4.6.5 here) prints it:
    3 2.177114918 aa:aa:aa:11:11:11 → Broadcast    ARP 42 Who has 192.168.1.20? Tell 192.168.1.175
    4 2.177311459 aa:aa:aa:22:22:22 → aa:aa:aa:11:11:11 ARP 42 192.168.1.20 is at aa:aa:aa:22:22:22
    5 2.177313709 192.168.1.175 → 192.168.1.20 ICMP 98 Echo (ping) request  id=0x0926, seq=1/256, ttl=64
    6 2.177450834 192.168.1.20 → 192.168.1.175 ICMP 98 Echo (ping) reply    id=0x0926, seq=1/256, ttl=64 (request in 5)
Two things in that list are worth knowing straight away. The Protocol column is the highest layer Wireshark recognized, not the only one: a ping is ICMP inside IP inside Ethernet. And the source and destination columns show IP addresses when there’s an IP layer, and fall back to MAC addresses when there isn’t, which is why the ARP lines look different.
The details pane is where the layers from Networking 101’s OSI lesson become visible. Click frame 5 and you get:
Frame 5: Packet, 98 bytes on wire (784 bits), 98 bytes captured (784 bits) on interface laptop:eth1, id 0
Ethernet II, Src: aa:aa:aa:11:11:11 (aa:aa:aa:11:11:11), Dst: aa:aa:aa:22:22:22 (aa:aa:aa:22:22:22)
Internet Protocol Version 4, Src: 192.168.1.175, Dst: 192.168.1.20
Internet Control Message Protocol
| Line | Layer | What it holds |
|---|---|---|
| Frame | none: Wireshark’s own notes | when and where the capture saw it, its length |
| Ethernet II | 2, data link | the MAC addresses, and the type of what’s inside |
| Internet Protocol Version 4 | 3, network | the IP addresses, the TTL, the protocol inside |
| Internet Control Message Protocol | 3, carried in IP | the ping itself |
For a web request you’d see TCP (layer 4) under IP, and HTTP under that. The order is the order of the envelopes on the wire: outermost first. Reading top to bottom is unwrapping the package.
The Frame line is the one people misread. It isn’t a protocol and nothing on the wire sent it. It’s the capture’s own label on the frame: the arrival time, the interface, the lengths. You’ll use it more than you’d think, because “on interface laptop:eth1” is the answer to “where was this seen?”.
The bytes pane is the honest one. The details pane is Wireshark’s interpretation of those bytes, made by a dissector: the piece of Wireshark that knows how to decode one protocol. Dissectors are very good, but when one guesses wrong (a protocol on an unusual port, say), the bytes are still right.
What do the timestamps mean?
Every frame gets a timestamp from the machine doing the capturing, at the moment the capture saw it. Not when the sender built it, and not when the receiver read it. That distinction matters as soon as you capture at more than one place, because two capture points have two clocks.
Wireshark shows the time in the packet list as seconds since the first frame by default. You can switch it (View › Time Display Format) to the time of day, or to the time since the previous frame, which is what you want when you’re looking for a pause. The real time is always in the Frame line:
Arrival Time: Nov 11, 2026 01:46:20.722588928 UTC
Timestamps are where a capture turns into measurements. In the capture above, the printer’s ARP reply came 196.5 microseconds after the laptop’s question (frame 3 to frame 4), and the first ping’s reply came 137 microseconds after the request (frame 5 to frame 6). Those numbers are from the laptop’s cable, so they include the switch, the printer’s own processing, and the switch again. A ping in the lab’s second capture, to a web server two routers away, took 566 microseconds, measured on the switch’s port towards the first router. Time between a question and its answer, measured on the asker’s cable, is the round trip that user actually experienced. Measured anywhere else, it’s the round trip from that point onwards.
What’s the difference between pcap and pcapng?
Captures are saved in one of two file formats.
pcap is the original, from the tcpdump world. It’s simple: a short file header, then one record per frame. pcapng (pcap next generation) is what Wireshark saves by default today, and what the lab’s captures use. It’s built from blocks, so it can say much more about the capture.
| pcap | pcapng | |
|---|---|---|
| Interfaces per file | one link type, no names | several, each with its name |
| Timestamp resolution | microseconds (the classic format) | per interface; nanoseconds in the lab’s files |
| Comments | no | on the file and on each frame |
| Which program made it | no | yes |
| Who can read it | nearly everything | Wireshark, tshark, tcpdump’s libpcap and most current tools |
Here’s what that means in practice. The lab’s capture of two switch ports, converted from pcapng to pcap with
Wireshark’s editcap, went from 1,524 bytes to 1,186. The bytes saved are the bad news: the interface names
sw1:eth1 and sw1:eth3 were gone (every frame now came from one nameless interface), and every timestamp
lost its last three digits:
pcapng: 1794361588.669028918
pcap:   1794361588.669028000
The interface name is the bit you’ll miss. When one file holds two capture points, that name is the only way to tell them apart. So keep captures in pcapng, and only convert when a tool demands pcap.
Why does where you capture decide what you see?
This is the section to remember. A capture records one point in the network, and what crosses that point depends on what’s around it.
A host’s own port
Capture on a host’s cable, as the lab’s first task does on the laptop, and you see everything that host sends and everything sent to it, plus the network’s broadcasts. That’s the easy case, because the host is one end of every conversation you’re looking at.
A switch port: other people’s unicast isn’t there
Networking 101’s lesson on switches gave the rule. A switch sends a frame for one MAC address out of one port, the one where it learned that address. It sends a broadcast out of every port. It floods a frame for an address it hasn’t learned yet out of every port too, but only until it learns it.
So a capture on a switch port sees that port’s own host, the broadcasts, and the occasional flood. Nothing else. The lab shows it with two captures taken at once, on sw1’s port towards r1 and its port towards the printer, while the laptop pings a server on another network:
| Seen on | ARP | ICMP (pings and replies) |
|---|---|---|
r1’s port, sw1:eth1 | the laptop’s request and r1’s reply | all 6 |
the printer’s port, sw1:eth3 | the laptop’s request only | 0 |
The printer’s cable carried exactly one frame of that conversation: the ARP request, because it was a broadcast. r1’s reply was addressed to the laptop alone, and the pings were addressed to r1’s MAC address, so the switch never sent them anywhere near the printer. That’s the switch doing its job.
It’s also why “I’ll plug my laptop into a spare switch port and capture” doesn’t work. You’ll see broadcasts, your own traffic, and very little else. In the days of hubs, which repeated everything to everyone, it did work. Switches ended that.
Mirror ports and taps
Real networks solve this in two ways.
A mirror port (Cisco calls it SPAN, for switched port analyzer) is a switch feature: you tell the switch to send a copy of everything on one or more ports, or a whole VLAN, out of another port, where your capture machine sits. It costs nothing but configuration. The catch is that it’s the switch’s best effort: a mirror port can only send as much as its own link carries, so if you mirror more traffic than that, some copies are dropped, and your capture is missing frames the real network delivered.
A tap is a small device you put in the cable itself. It passes the traffic through and copies it to a monitoring port. It sees exactly what was on the wire, but you have to break the cable to install it, which is why taps go in during planned work and stay there.
The lab does something closer to a tap: containerlab capture records a port from outside the node, so
nothing on the laptop or the switch knows it’s being watched, and you can capture any cable in the network.
Inside a host versus on the wire
There’s one more place to capture: on the host itself, with Wireshark installed on the laptop. That’s the most common capture there is, and it comes with a surprise.
Modern network cards do work the operating system used to do. Two kinds of this offload change what a capture on the host shows. With checksum offload, the card fills in the IP and TCP checksums just before the frame leaves, so a capture of outgoing traffic, taken before the card, sees checksums that haven’t been calculated yet. With segmentation offload, the operating system hands the card one big block of data and the card cuts it into frames, so the capture shows “packets” larger than the network’s MTU, which no real cable could have carried. Wireshark’s own page on offloading explains both.
Neither is a fault. Both are the capture being honest about where it is: above the card, not on the wire. If a host capture shows bad checksums on everything it sent, or 1,500-byte limits apparently ignored, check offloads before you suspect the network.
| Capture point | Sees | Doesn’t see |
|---|---|---|
| on the host itself | what that host sent and received, as the OS saw it | other hosts’ traffic; the final checksums and frame sizes |
| a switch port | that port’s host, broadcasts, floods | other hosts’ unicast |
| a mirror (SPAN) port | copies of the ports or VLAN you chose | copies the switch dropped when the mirror was full |
| a tap | exactly what was on that cable | anything on another cable |
What I see go wrong
Capturing in the wrong place, and believing the silence. Someone captures on the server, sees no request, and concludes the client never sent one. Maybe it didn’t. Or maybe it was dropped on the way, or went to a different server. A capture can prove a frame crossed a point. Its absence only proves it didn’t cross that point. The fix is a second capture closer to the sender, and lesson 8 of this course is built around it.
Expecting a switch port to show everyone. It won’t, as the table above shows. If you need someone else’s traffic, capture on their port, on the uplink they use, or on a mirror of it.
Comparing timestamps from two machines. Two captures taken on two computers use two clocks. A few milliseconds’ difference between them is often just the clocks disagreeing. Compare times within one capture, or use one machine that records both points into one file, which is what the lab does.
Reading checksum errors as damage. On a host capture, outgoing frames with “incorrect” checksums are almost always checksum offload. Damaged frames on a real wire usually don’t reach a capture at all, because the receiving card throws them away.
Saving in a format that loses the answer. A multi-point capture converted to pcap has lost the one field that says which point each frame came from.
Try it
Chapter 1 of the lab has you take your first capture on the laptop’s cable, open it in Wireshark in your browser, read the three panes, and then capture two switch ports at once to see for yourself which cable carried which frames.
What’s next
A busy network gives you thousands of frames a second. Lesson 2 is about cutting that down: capture filters, which decide what’s saved at all, and display filters, which decide what you look at, and the one small operator whose meaning changed under everyone’s feet.
Related doodles
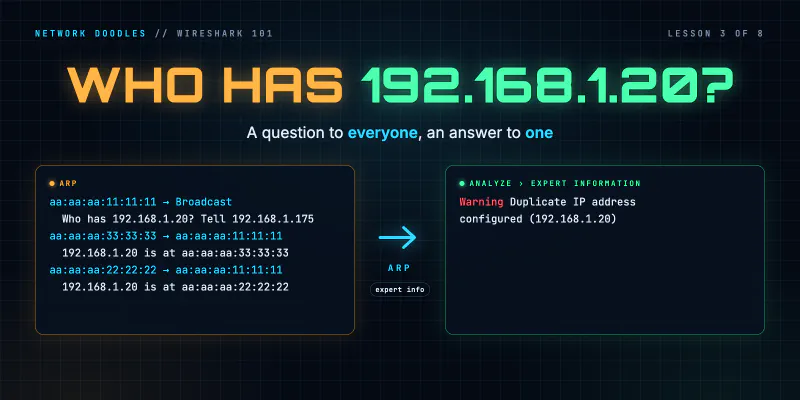
ARP on the Wire: Who Has This Address? (Wireshark 101, Lesson 3)
ARP turns an IP address into a MAC address with one broadcast question and one unicast answer. The fields, the neighbor cache, ARP for the gateway, …
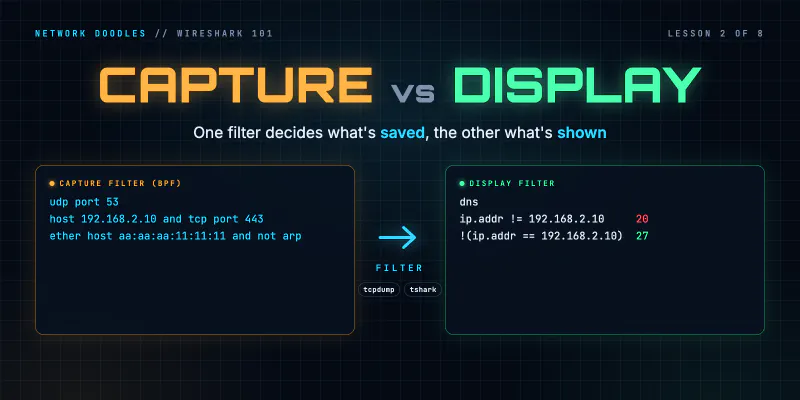
Capture Filters vs Display Filters (Wireshark 101, Lesson 2)
Capture filters decide what's saved and can't be undone. Display filters decide what you see. BPF vs Wireshark fields, contains and matches, and why …
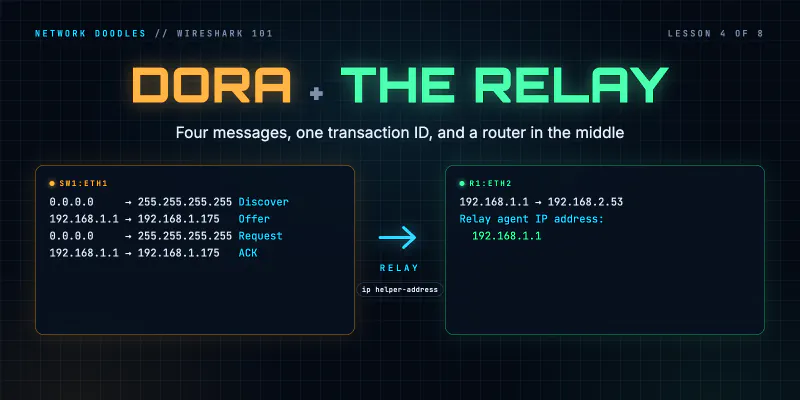
DHCP on the Wire: How a Host Gets an Address (Wireshark 101, Lesson 4)
DHCP in packets: four messages sent before the host has an address, the options that matter, leases and renewal, and how a relay with ip …